Maternal mortality signifies the deaths of women that take place during pregnancy, labor, or the puerperium, once frequently referred to as “deaths in childbirth.”
Despite past claims, in the context of total deliveries, maternal death was a rare event compared with death from disease. Even in the worst periods of the eighteenth and nineteenth centuries, the mother survived in at least 98 percent of deliveries.
Nonetheless, a death rate of 1 to 2 percent is high when the average number of deliveries per day is about 2,000, as it was in England and Wales by the end of the nineteenth century. In the United States during the 1920s, for example, death in childbirth claimed some 15,000 to 20,000 lives a year, and it was second only to tuberculosis as a cause of death in women of childbearing age.This essay is about the historical epidemiology of maternal mortality — the distribution and determinants of maternal mortality in different populations at different periods. The epidemiological approach to the history of maternal mortality is not, of course, the only one, but it is the method that makes the greatest use of statistics to attempt to discover why the mortality rate changed at different periods, and why one region or one country suffered more maternal deaths than another. It is necessary to examine a broad range of clinical, social, political, economic, and geographic factors, all of which affected childbirth in different countries and at different times. Although this is a historical exercise, some of the answers are undoubtedly relevant to obstetric problems in certain parts of the Third World today.
To illustrate how maternal mortality is determined, the trend in England and Wales will be examined first. Maternal deaths and other data are shown in Table IV.2.1 for certain selected decennia and in Figure ΓV.2.1 for successive decennia from the 1850s through the 1970s.
In England and Wales the population of women of childbearing age more than doubled between the 1850s and the 1970s, but the birthrate more than halved, so that the average number of births per day (or per decade) was almost exactly the same in the 1850s and the 1970s.
But the risk of childbirth had been enormously reduced. Total maternal deaths, as shown in Table IV.2.1, rose from an average of 8.5 per day in the 1850s to a peak of 12 per day in the 1890s before descending to the present level of about 1 per week. In the nineteenth century, a woman would most likely have known of at least one death in childbirth among her friends or neighbors, if not her own family. Today, maternal deaths are so rare that very few people have personal knowledge of such a tragedy.There is a certain pattern of mortality with which historians and epidemiologists are familiar. It consists of a general decline in deaths dating either from the mid-nineteenth century or from the beginning of the twentieth. This decline was seen, for instance, in death rates from all causes, deaths from the common infectious diseases, and infant mortal-
Table IV.2.1. Birthrates and maternal deaths in England and Wales, 1851—1980
| Decennium | Population of women aged 15-44 (millions) | Birthratea | Average number of births per day6 | Average number of maternal deaths per day6 | Average annual maternal deaths per million women aged 15-44 | Maternal deaths per 10,000 births |
| 1851-60 | 4.60 | 144.8 | 1,775 | 8.5 | 675 | 47.0 |
| 1891-1900 | 7.50 | 122.9 | 2,507 | 12.0 | 621 | 50.9 |
| 1951-60 | 9.27 | 77.1 | 1,938 | 1.1 | 43 | 5.6 |
| 1971-80 | 9.77 | 67.3 | 1,772 | 0.23 | 8 | 1.2 |
Note: For all three quantities, the value for the 1850s is expressed as 100; subsequent values are shown as the percentage above or below the level of the 1850s.
“Birthrate expressed as births per 1,000 women aged 15-44.
6Average daily births and maternal deaths for the decade.
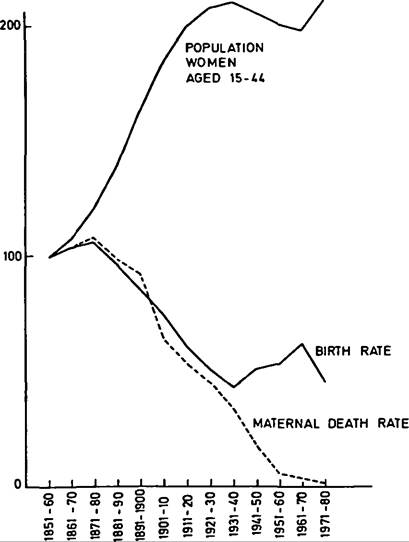
Figure IV.2.1. Birthrates and maternal mortality rates for England and Wales, 1851-1980. Values for 1850 = 100. (From Annual reports, Decennial Supplements and Statistical Reviews of the Registrar General for England and Wales.)
ity. The reasons for the decline have been debated for a number of years. In the past it was attributed to advances in scientific medicine. It is now generally accepted that the decline in mortality rates before the Second World War had little to do with advances in medical or surgical therapy, but a great deal to do
215 with a general improvement in health and hygiene associated with a rising standard of living.
Figure ΓV.2.1 shows maternal deaths per million women of childbearing age. The graph appears at first sight to conform to the general pattern, because it shows that maternal deaths declined from the 1870s onward. However, this decline is seen only when the birthrate is ignored and maternal mortality is measured solely in terms of the total number of women of childbearing age. In fact, the population at risk is not all women of childbearing age; it is only women during pregnancy, labor, or the puerperium. Maternal mortality has to be measured in terms of births, not total population, and Figure ΓV.2.1 shows clearly that the birthrate was declining alongside deaths in childbirth.
The maternal mortality rate (henceforth, the MMR) is therefore calculated by dividing the total number of registered maternal deaths (the numerator) by the total number of registered births (the denominator). The quotient is then multiplied by 1,000, 10,000, or, as is usual today, 100,000. Deaths per 10,000 births is the most convenient when one is working with historical data and is used here. The ideal denominator for the calculation of maternal mortality would, of course, be pregnancies rather than births; but total pregnancies cannot be recorded when there are no statistics on abortions or multiple births from single pregnancies.
Total births (or live births before stillbirths were registered) are therefore used instead.When the MMR is calculated in terms of births rather than women of childbearing age, the graph is very different (Figure IV.2.2). Between the 1850s and 1930s the MMR, far from declining, remained on a plateau while other major causes of death were declining. This plateau, and the steep and sustained decline that started in the mid-1930s, are the two prominent features of the graph. The plateau suggests that the factors that caused a general decline in death rates between the 1870s and the mid-1930s had no effect on the MMR. This is especially surprising when one recalls that obstetrics differed from the use of medicine in surgery in that, starting in the 1880s, certain measures were introduced into obstetric practice that should have reduced mortality. These included antisepsis and asepsis, the compulsory regulation and training of midwives, and the growing importance of antenatal care. But it appears that at the national level they had no effect. There is yet another unusual feature of maternal mortality: the correlation with social class. For most of the common causes of death in the past, social-class gradients existed, with the highest mortality rates among the poor and lowest among the well-to-do. In the case of the MMR, the gradient was reversed.
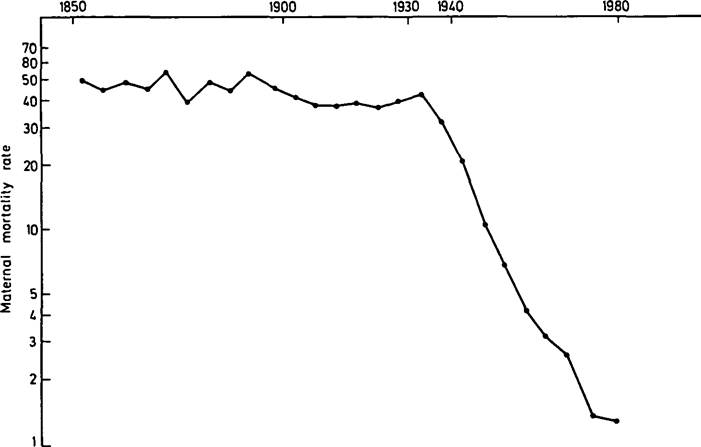
Figure ΓV.2.2. Matemal mortality rates for England and Wales, 1851-1980 (logarithmic scale). Matemal mortality rates expressed as maternal deaths per 10,000 births. (From Annual reports, Decennial Supplements and Statistical Reviews of the Registrar General for England and Wales.)
From the mid-1930s, the abrupt and sustained decline in mortality is as striking as the previous absence of any decline. Maternal mortality is puzzling and fascinating because of these unexpected features. Were England and Wales, however, unusual in these respects, or were similar trends found in other countries?