Twentieth-Century Cigarette Tobaccosis
A comprehensive view of evolving tobacco use patterns in the United States during this century is presented in Table IIL8.1, which documents the progressive trend from cigar smoking and the use of “manufactured tobacco” (pipe tobacco, chewing tobacco, and snuff) to cigarette smoking.
Annual production of manufactured tobacco increased from 301 million pounds in 1900 to a peak of 497 million pounds in 1918 and subsequently decreased to 142 million pounds (1988). During the twentieth century, cigar production oscillated between 4 and 10 billion annually, with more cigars produced in 1900 (5.6 billion) than in 1988 (3.2 billion).Meanwhile, cigarette production and consumption increased more than 100-fold, with consumption increasing from 2.5 billion cigarettes in 1900 to 640 billion in 1981, then decreasing to 562 billion in 1988. On a per capita basis in the United States, annual cigarette consumption increased from 54 per adult in 1900 to a peak of 4,345 per adult in 1963. Since then it has decreased to 3,096 cigarettes per adult in 1988.
The foremost determinants of national cigarette consumption can be inferred from the trend changes seen in Figure III.8.1. Cigarette consumption doubled during World War I, when cigarettes were included in soldiers’ rations sent to France. It doubled again during the 1920s, propelled by innovative advertising campaigns and augmented by radio and cinema. But then it decreased during the early years
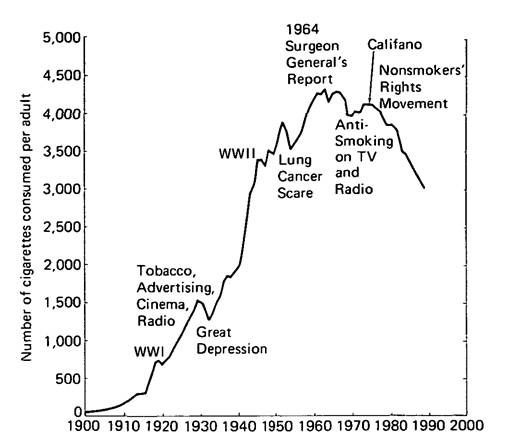
Figure III.8.1. Annual consumption of cigarettes by U.S. adults (18 years of age and older), 1900-88. (Data from the Economic Research Service, U.S. Department of Agriculture.)
of the depression of the 1930s, only to increase during the latter part of the decade, presumably in response to intensified advertising in magazines, on billboards, and on radio as well as in response to the incessant smoking of popular film stars and other famous personalities.
During World War II, when cigarettes were made freely available to many military and some civilian groups, consumption almost doubled again-from 1,976 cigarettes per adult in 1940 to 3,449 in 1945. After the war, cigarette consumption continued upward until 1950, when scientific findings showed smoking to be the principal cause of a rapidly increasing epidemic of lung cancer. However, tobacco sales soon recovered.
Intense wrangling over the validity of research findings on the harmful effects of tobacco generated so much confusion that in 1962 Surgeon General Luther Terry established the Advisory Committee of Experts, whose landmark report on 11 January 1964 rendered an authoritative verdict: “Cigarette smoking is causally related to lung cancer in men; the magnitude of the effect of cigarette smoking far outweighs all other factors. The data for women, though less extensive, point in the same direction.”
Again the tobacco industry took vigorous defensive action with intensified advertising; but when a fairness doctrine required that advertising messages on radio and television be balanced by antismoking messages, tobacco advertising was discontinued in the broadcast media.
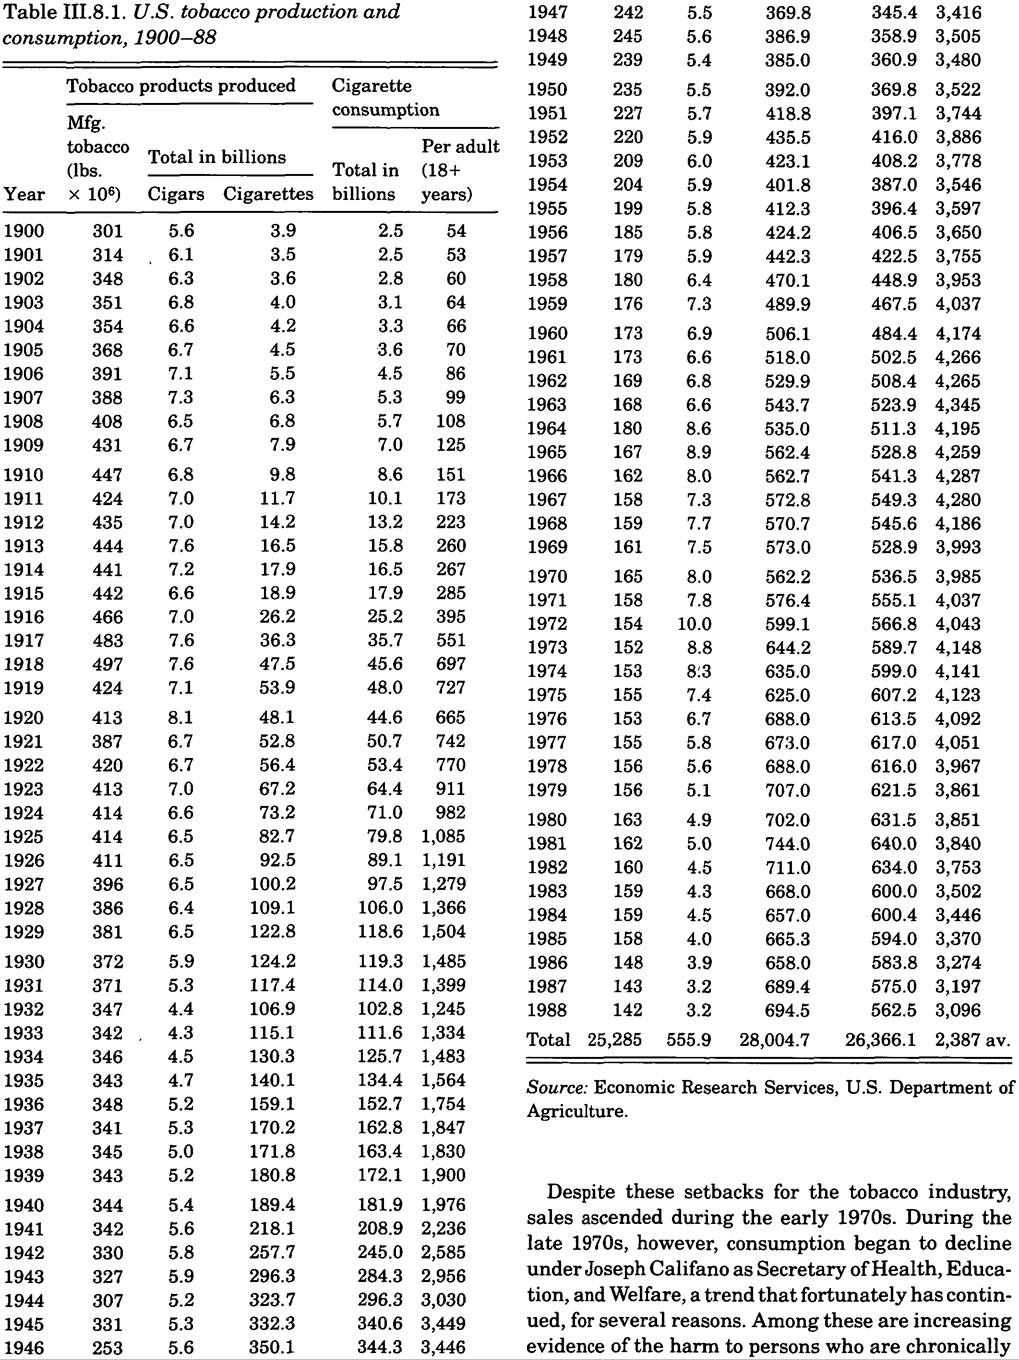
Table IΠ.8.2. Per capita adult consumption of manufactured cigarettes by country, 1985
| Cyprus | 4,050 | Netherlands | 1,690 | |
| Cuba | 3,920 | Sweden | 1,660 | |
| Greece | 3,640 | Suriname | 1,660 | |
| Poland | 3,300 | Trinidad and | ||
| United States | 3,270 | Tobago | 1,600 | |
| Japan | 3,270 | Algeria | 1,590 | |
| Hungary | 3,260 | China | 1,590 | |
| Canada | 3,180 | Hong Kong | 1,580 | |
| Iceland | 3,100 | South Africa | 1,550 | |
| Yugoslavia | 3,000 | Tunisia | 1,470 | |
| Switzerland | 2,960 | Barbados | 1,380 | |
| Lebanon | 2,880 | Nicaragua | 1,380 | |
| Libyan Arab | Costa Rica | 1,340 | ||
| Jamahiriya | 2,850 | Fiji | 1,320 | |
| Kuwait | 2,760 | Mexico | 1,190 | |
| Spain | 2,740 | Democratic Peo | ||
| Australia | 2,720 | ple’s Republic | ||
| Republic of | of Korea | 1,180 | ||
| Korea | 2,660 | Guadeloupe | 1,080 | |
| Austria | 2,560 | Morocco | 1,070 | |
| Ireland | 2,560 | Indonesia | 1,050 | |
| Czechoslovakia | 2,550 | Honduras | 1,010 | |
| New Zealand | 2,510 | Chile | 1,000 | |
| Italy | 2,460 | colspan=2 bgcolor=white>Paraguay1,000 | ||
| Bulgaria | 2,410 | Guyana | 1,000 | |
| France | 2,400 | Iraq | 980 | |
| Germany, Fed | Dominican | |||
| eral Republic | 2,380 | Republic | 980 | |
| Germany, Demo | Reunion | 940 | ||
| cratic Republic | 2,340 | Congo | 920 | |
| Israel | 2,310 | Thailand | 900 | |
| Singapore | 2,280 | Ecuador | 880 | |
| USSR | 2,120 | Panama | 850 | |
| United Kingdom | 2,120 | Sierra Leone | 830 | |
| Denmark | 2,110 | Jamaica | 820 | |
| Saudi Arabia | 2,110 | El Salvador | 750 | |
| Romania | 2,110 | Benin | 740 | |
| Syrian Arab | Cote d’Ivoire | 710 | ||
| Republic | 2,050 | Vietnam | 670 | |
| Belgium | 1,990 | Pakistan | 660 | |
| Turkey | 1,970 | Iran | 620 | |
| Norway | 1,920 | Senegal | 610 | |
| Colombia | 1,920 | Cameroon | 610 | |
| Philippines | 1,910 | Guatemala | 550 | |
| Venezuela | 1,890 | Kenya | 550 | |
| Egypt | 1,860 | Angola | 530 | |
| Malaysia | 1,840 | Zimbabwe | 500 | |
| Argentina | 1,780 | Sri Lanka | 500 | |
| Uruguay | 1,760 | Lao People’s | ||
| Portugal | 1,730 | Democratic | ||
| Finland | 1,720 | Republic | 490 | |
| Jordan | 1,700 | Togo | 460 | |
| Brazil | 1,700 | Madagascar | 450 | |
| Mauritius | 1,700 | Liberia | 450 | |
| Mozambique | 430 | Cape Verde | 210 | |
| Zambia | 400 | Zaire | 210 | |
| Malawi | 390 | India | 160 | |
| Ghana | 380 | Chad | 150 | |
| Nigeria | 370 | Burma | 150 | |
| Peru | 350 | Nepal | 150 | |
| Bolivia | 330 | Sudan | 130 | |
| United Republic | Niger | 100 | ||
| of Tanzania | 330 | Ethiopia | 60 | |
| Central African | Afghanistan | 50 | ||
| Republic | 280 | Papua New | ||
| Bangladesh | 270 | Guinea | 30 | |
| Uganda | 260 | Guinea | 30 | |
| Haiti | 240 | Burkina Faso | 30 | |
Note: An adult is defined as someone 15 years of age and over.
Source: WHO Program on Smoking and Health.
exposed to smoke generated by others and stronger antitobacco activities by official and voluntary agencies at national, state, and local levels, as well as the vigorous campaign mounted by Surgeon General C. Everett Koop.
World Tobacco Trends
During recent decades, as antitobacco movements have hobbled tobacco promotion and sales in some of the affluent countries and as income levels have risen in many less developed countries, the multinational tobacco companies have intensified their advertising efforts in the less developed world, resulting in the global tobacco consumption pattern seen in Table III.8.2.
The leading countries in the production and consumption of tobacco are China, the United States, the Soviet Union, Japan, the Federal Republic of Germany, the United Kingdom, Brazil, India, Spain, France, and Italy. World production and consumption of cigarettes now exceed 5 trillion annually — more than enough to raise the world tobaccosis death toll substantially above the current level of about 3 million annually. Fortunately, during the 1980s the World Health Organization began to exercise forthright leadership in supplying information on this difficult issue, though it had not yet applied financial and personal resources commensurate with the nature and magnitude of the tobaccosis pandemic.