Archaeogenetics of contemporary Europeans
The question of the Neolithic transition in Europe has, alongside that of the origin of modern humans, virtually defined the history of archaeogenetics, from the work of Cavalli-Sforza and his colleagues onwards.
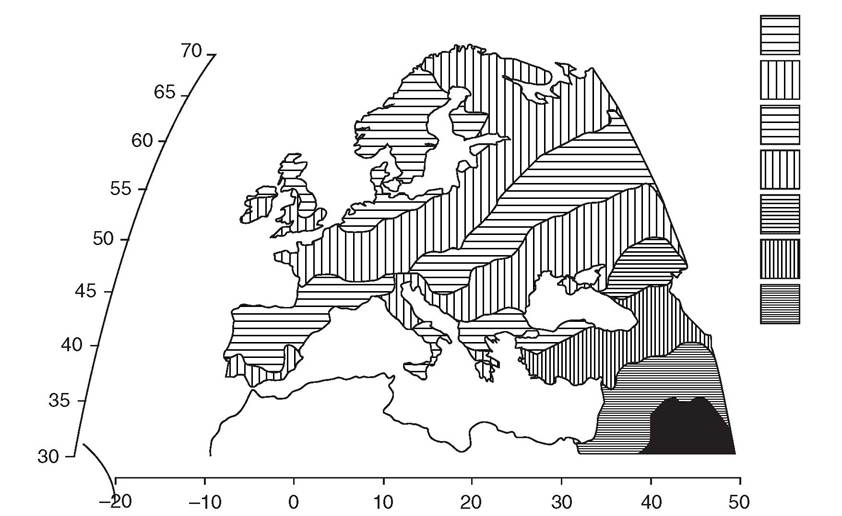
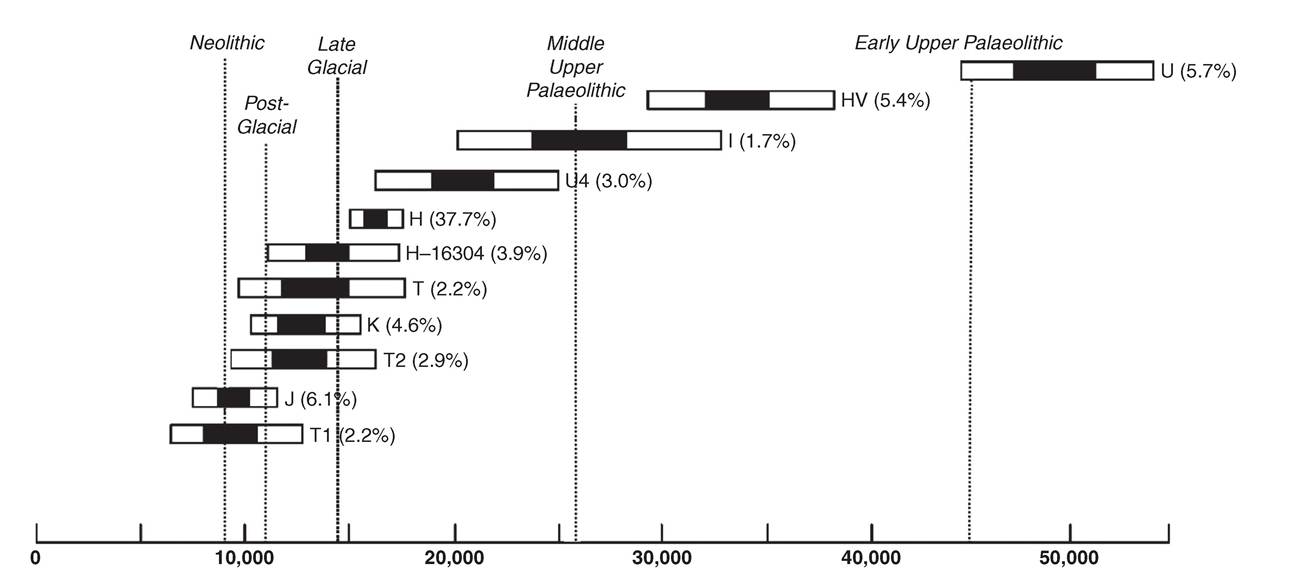
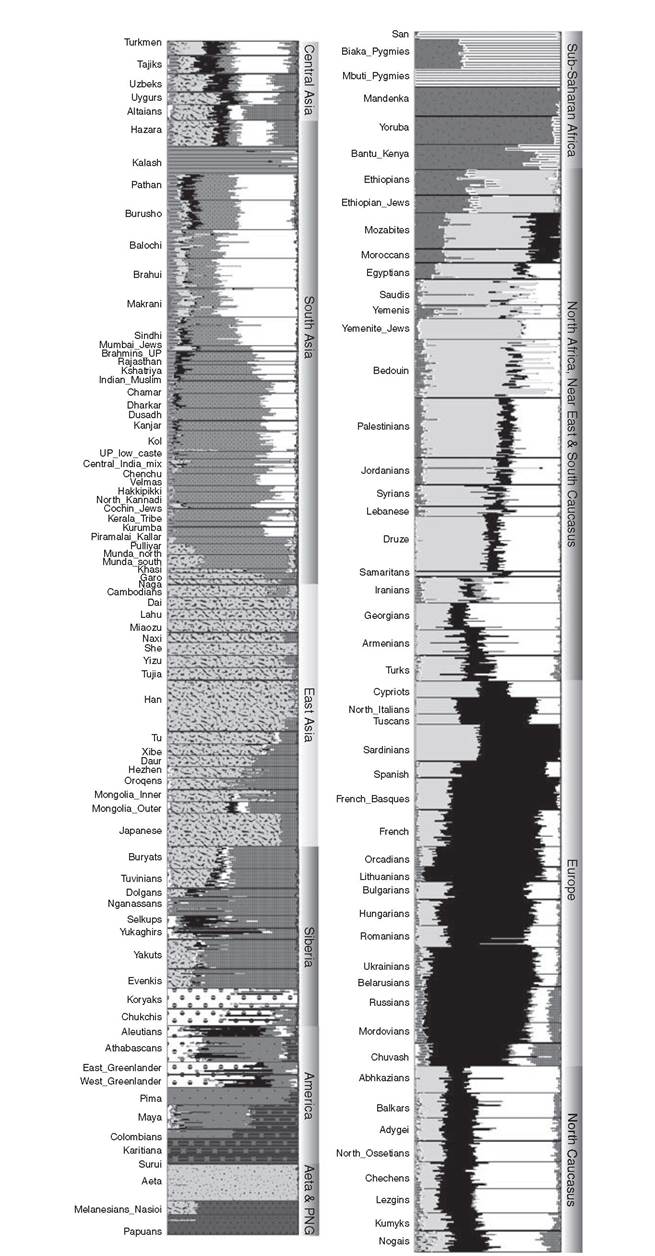
They dissected the genetic-geographic patterns with principal components analysis, interpreting the major southeast to northwest gradient of markers in Europe - along the axis of the known gradient of Neolithic radiocarbon dates - as the result of a large-scale demic expansion of Near Eastern populations into Europe with the onset of the Neolithic (Figure 2.1). This led them to strongly emphasize the expanding early farmers at the expense of the indigenous Mesolithic foraging populations, defining the debate in a way that has endured, despite huge and ongoing controversy, ever since.This fairly simplistic view of the transition was of course challenged by archaeologists, especially those studying the evidence for pre-Neolithic European foragers.12 However, the first genetic critique came with the advent of DNA studies, and in particular from analyses of mtDNA in the mid-1990s - at that time, focused on just a short segment of the control region. Richards and colleagues estimated that only 10-15 per cent of extant [22] [23] Figure 2.1 Synthetic map of the first principal component of variation in ninety-five classical genetic markers. mtDNAs had dispersed from the Near East to Europe at the time of the Neolithic, after around 10,000 years ago.[24] Most of the European mtDNAs appeared to have already been established in Europe by this time, among the Mesolithic and preceding Palaeolithic foraging groups scattered across the continent. This work was bolstered by further studies, involving many more samples, a slightly higher resolution, and a formal founder analysis for which software had been specially developed in the meantime.[25] [26] 15 This resulted in a range for the estimates of extant European mtDNA lineages dating to the Neolithic of 10-22 per cent (Figure 2.2). Meanwhile, Torroni and colleagues had zeroed in on one particular cluster, haplogroup V, tracing its spread from a glacial refuge area in southwestern Europe in the late Glacial period, at the end of the last Ice Age, around 14,000 years ago.15 Subsequent work focused on several Years before present Figure 2.2 Plot of the age ranges of the major mitochondrial DNA founder clusters in Europe, inferred from a founder analysis of control-region sequences and accounting for three quarters of the variation in Europeans. Founder clusters are sets of sequences in the sink population with a common ancestor in a DNA sequence type (‘founder type') that has been identified as having migrated from a source (the Near East) into a settled region or sink (Europe), so that the estimate of their coalescence time can serve as a proxy for the timing of the migration. 95 per cent credible regions on the age estimates are shown by white bars and 50 per cent regions by black bars. The founders were identified by a criterion that scaled the amount of variation present in the Near East to the frequency in Europe; under this criterion, the total fraction of lineages arriving with the Neolithic was estimated at approximately 13 per cent, but subsequent work with better-resolving whole-mtDNA sequences suggests that this is likely to have been an over-estimate (see text). of the clusters within the much more common haplogroups H and U5, suggesting a similar late Glacial ancestry within Europe.[27] Recent simulation studies support this view, suggesting that late Glacial expansions might in fact generate the kind of southeast-northwest gradient patterns seen in the classical markers, and that Neolithic immigration is therefore likely to have been minor, turning the classical picture on its head.1[28] Although often cited as supporting a basically ‘indigenist' conclusion, the mtDNA researchers interpreted their results in terms of a pioneer colonization model, with significant Neolithic immigration and leapfrog dispersals across Europe, with a source in the Near East, but ultimately involving widespread assimilation of indigenous forager populations into the resulting gene pool, along similar lines to those proposed on archaeological grounds by Zvelebil and Rowley-Conwy.[29] [30] The main criticism levelled at the time against the mtDNA work was famously summarized by Barbujani and colleagues as follows: ‘suppose that some Europeans colonize Mars next year: If they successfully establish a population, the common mitochondrial ancestor of their descendants will be Palaeolithic. In fact, the conclusions from the mtDNA work have been modified in various ways with the advent of whole mitogenome studies. One of the most significant has been the result of freshly calibrating the mtDNA clock. A number of researchers had argued for the time-dependency of the mtDNA rate, but the case was made most cogently by Kivisild and colleagues, who showed that the apparent rate of mtDNA coding sequence evolution slows down as one moves back through the tree, due to the removal of weakly deleterious mutations by purifying selection. This meant that the timing of the more recent coalescent events had tended to be over-estimated. Thus when Soares and colleagues estimated the first whole mitogenome clock rate, they included a correction factor to allow for this effect. Although not affecting conclusions to the extent predicted by some, this new calibration had the curious effect of moving some putative late Glacial mtDNA lineages, previously dating to 13-15 ka (thousands of years ago), into the immediate post-Glacial, or Mesolithic, c. Studies of extant Y chromosome (MSY) lineages have proved even more controversial. At around the time of the publication of the mtDNA founder analysis, a major study of MSY variation by Semino and colleagues (including Cavalli-Sforza himself) came to broadly similar conclusions. They estimated a roughly 22 per cent component dating back to Neolithic immigration from the Near East, essentially summing the lineages belonging to MSY haplogroups which are frequent in the Near East. This formula could conflate Neolithic immigration with both more recent and somewhat earlier dispersals of these lineages from the Near East into Europe, but King and Underhill subsequently correlated high frequencies of these lineages in Europe with early Neolithic archaeological traditions along the Mediterranean coast.[32] Both approaches, however, rapidly came under fire from population geneticists wielding admixture models.[33] They argued that the MSY results, in particular, indicated a much higher level of Neolithic Near Eastern ancestry in Europe - more than 50 per cent, and nearing 100 per cent in the southeast. The problem here though was the suitability of the admixture approach. Admixture is designed to measure the contribution of each source population to a third, hybrid, population formed when the first two mix together, by comparing the sink variation with that in each source. But neither assumption is tenable: we have no pristine representative of Mesolithic Europe available, and in any case Europe was probably highly structured in the Mesolithic, so that even if the Basques were a relict of the southwest they could hardly be used as a proxy for the northeast or southeast, for example. Moreover, mtDNA studies strongly imply that there has been a huge level of migration from Europe into the Near East over the last ten thousand years, which would greatly exaggerate the Near Eastern fraction in an admixture estimate.[34] Finally, admixture studies suffer from the weaknesses of the original PC analyses - they do not distinguish different events or tell us when the admixture occurred. This is why phylogeographers believe that some kind of founder analysis, however difficult, is a much more appropriate way to estimate the scale of the Near Eastern Neolithic impact. For example, recent work with mtDNA has suggested that at least some of the expansion into Europe from the Near East attributed by Cavalli- Sforza and his colleagues to the Neolithic may in fact have taken place in the late Glacial. But Y-chromosome phylogeography has not provided definitive answers either. The early picture was of western Europe being peopled after the Ice Age from a southwest refuge area, similar to the model of late Glacial/post- Glacial expansions implied by the mtDNA. However, Balaresque et al. suggested that the microsatellite diversity among these lineages was highest in Anatolia and low in northern and western Europe, and suggested an expansion from east to west in the timeframe of the Neolithic. The genomic era has, of course, also seen a return in force of autosomal systems, as testing hundreds of thousands of genome-wide SNPs (singlenucleotide polymorphisms) has become routine, and complete genomes start to appear in greater numbers. The first applications of genome-wide scans to European population structure provided the striking image of the plot of the first two PCs mapping almost perfectly onto the geography of Europe.24 Since these components amount to less than 0.5 per cent of the total variance in the data, however, how this astonishing pattern is to be distinct domains of prehistoric gene flow in Europe', American Journal of Human Genetics, 75 (2004), 128-37; P. Balaresque et al., ‘A predominantly Neolithic origin for European paternal lineages', PloS ONE, 8 (2010), eι000285; L. Morelli et al., ‘A comparison of Y-chromosome variation in Sardinia and Anatolia is more consistent with cultural rather than demic diffusion of agriculture', PLoS ONE, 5 (2009), eι0419; N.M. Myres et al., ‘A major Y-chromosome haplogroup Rib Holocene era founder effect in central and western Europe', European Journal of Human Genetics, 19 (2011), 95-101; G.B. Busby et al., ‘The peopling of Europe and the cautionary tale of Y chromosome lineage R-M269', Proceedings of the Royal Society B, 279 (2011), 884-92. 24 J. Novembre et al., ‘Genes mirror geography within Europe', Nature, 456 (2008), 98-101. interpreted is anyone's guess. More interesting for the question of deep European ancestry has been the development of various tsTRucτuRE-like' algorithms for gathering such data into genetically defined clusters, putatively representing ancestral populations.[35] The clusters are identified by the software, although the number of clusters (K) is defined by the user. Several large published data sets include both Near Eastern and European data.[36] [37] [38] The results broadly indicate (e.g. from K = 5 through 10 for a worldwide sample) that European and Near Eastern samples fall into three main genetic clusters (Figure 2.3). The major one present in Europe (shown in black in Figure 2.3) exceeds 75 per cent in northern, western, and eastern Europe (including Basques and Saami), is a minority in the Near East - almost absent from Arabia and about 10 per cent for populations in the vicinity of the Fertile Crescent - but is found at about 25 per cent in northwest (but not northeast) Africans. We can hazard a guess that this cluster has a longstanding ancestry in Europe, given that we know of substantial gene flow from Europe into the Fertile Crescent from the mtDNA evidence. A second cluster (shown in grey) is found in a minority in western (especially Mediterranean) European populations, including Basques and Sardinians (both often thought to have predominantly indigenous ancestry), and is also common across the Near East (focused on the south, including Arabia) and North Africa, but much less so in eastern Europe. The third cluster (shown in white), which is found as a minority across both western and eastern Europeans, is similarly common across the Near East, but more focused on the north, especially the Caucasus and to some extent also the Fertile Crescent, but much less so in Arabia and North Africa, and stretches into Central and South Asia. We can guess that both of these clusters may be indigenous to the Near East, but with southern and western (Mediterranean) and northern and eastern orientations, respectively. If this interpretation is not too bold, then it suggests that Near Eastern introgression into Europe has varied from less than 10 per cent in the northwest and northeast to around 40 per cent in Italy and the southeast. Figure 2.3 Genome-wide SNP admixture analysis of global populations. admixture is a tsτRucτuRE-like, model-based clustering algorithm that essentially identifies This would provide a maximum value for genome-wide Neolithic introgression; so the modern autosomal analyses seem to support a very substantial indigenous pre-Neolithic component in the ancestry of most Europeans. Given the mtDNA evidence for late Glacial expansions from the Near East into Mediterranean Europe preceding the Neolithic, however, it is tempting to hypothesize that the second ‘Mediterranean' cluster might represent this process, and the third the spread of the Neolithic. If this were correct, the Neolithic Near Eastern contribution to the European autosomal pool would be between virtually zero (in, say, Basques and Sardinians as well as Saami) and about 25 per cent in southeastern Europe and mainland Italy. It is important to realize, though, that what can be inferred from the modern genetic patterns does not always address the most interesting archaeological questions. In the end, unfortunately, different lines of evidence tell us different things. Even if we assume that about 20 per cent of the modern maternal lineages really do descend from Neolithic newcomers, what does that actually imply in terms of what was going on at the time? Unless it was a simple admixture event, then a 20:80 figure cannot be demographically very meaningful. For example, the people actually crossing into Europe might have numbered only ι per cent (say) of the population of Europe at that time, but expanded to 20 per cent before (or even after) interacting with the locals. We can explore the alternatives via simulation, to some extent, but choosing between them is another matter. This is where ancient DNA can come into its own.
More on the topic Archaeogenetics of contemporary Europeans:
- Archaeogenetics of contemporary Europeans
- Barker Graeme, Goucher Candice (ed.). The Cambridge World History. Volume 2. A World with Agriculture, 12,000 BCE-500 CE. Cambridge University Press,2015. — 668 p., 2015
- Ancient DNA in Europe