63 Gout
Gout is a chronic, intermittently symptomatic disease. It is manifested primarily by small numbers of acutely painful swollen joints that result from an inflammatory reaction to the precipitation of crystals of monosodium urate.
Etiology
The predisposing metabolic factor for primary gout is an abnormally high or rapidly changing concentration of uric acid in the blood. Hyperuricemia may result from an accelerated synthesis of uric acid, or decreased excretory capacity for uric acid in otherwise normal kidneys as a result of Imidentified but probably heritable causes. Hyperuricemia leading to secondary gout occurs particularly (1) in diseases of the blood-forming tissues that increase the availability of precursors of uric acid; (2) in kidney failure, which limits the excretion of uric acid; or (3) as a result of medications that either accelerate the breakdown of purine-rich cells (e.g., antineoplastic drugs) or interfere with the renal excretory mechanism (e.g., some diuretics). Dissolved in the serum, uric acid is harmless. However, because of unidentified local circumstances it may leak from capillaries and crystallize. The crystals of monosodium urate elicit the inflammatory reaction, which is the gouty attack, and the microscopic identification of the crystals in synovial fluid confirms the diagnosis. Why this inflammation occurs predominantly in joints, and why much more commonly in some joints (such as those of the feet or in the knee) than in others (such as the hip or those of the vertebral column) are unexplained characteristics. Unexplained as well is the question why tophi, which are urate deposits that form beneath the skin, are usually painless and the antiuricemic effect of estrogens.
Clinical Manifestations
Fully 90 to 95 percent of patients are male, and gout rarely develops in women before menopause.
The first attack most often occurs in the fifth decade in men and in the sixth decade in women. The rate of production of uric acid and, related thereto, the onset of primary gout, thereafter diminishes.The normal uric acid content, the “miscible pool,” in men is about 1.2 grams, and in women, 0.6 grams (Seegmiller, Laster, and Howell 1963). Because of an imbalance between synthesis and excretion, uric acid accumulates in part as the subcutaneous deposits called tophi. About 50 percent of untreated patients have tophi 10 years after their first attack of gout. Thus 53 percent of the cases seen in the Mount Sinai Hospital (New York) Gout Clinic during 194853 had tophi, whereas tophi were found in only 14 percent of the cases of gout first seen at the Mayo Clinic in 1949. The difference presumably was the result of referral bias. However, the incidence of tophaceous gout has decreased steadily in both institutions: In New York during 1969-73, it was 17 percent of all gout patients, and at the Mayo Clinic in 1972 it was only 3 percent (Yu 1984). Statistics of cases gathered in London during 1958—67 revealed that 21 percent had tophi, whereas 28 percent of cases seen at a German health resort during 195564 had tophaceous gout.
Next to tophi the most common uratic manifestation of gout is kidney stones (.nephrolithiasis). This association has been noted since at least the sixteenth century. Uric acid stones constitute no more than 5 percent of all kidney stones, but about 80 percent of calculi in cases of gout. How close the relationship between gout and urate nephrolithiasis may be is uncertain. Although 22 percent of the 1,258 New York gout patients studied by T.-F. Yu and A. B. Gutman (1967) had renal calculi at some time, this condition antedated the first attack of gout in 40 percent, and in 14 percent the delay was from 11 to 39 years. The probability of nephrolithiasis is correlated with the serum urate content. Thus, 15 percent of their total cases of gout had serum urate of less than 8 milligrams per 100 grams of blood (mg%) without treatment, and nephrolithiasis developed in 15 percent of these; in 32 percent of the gout patients the urate concentration exceeded 10 mg%, and 43 percent of these had nephrolithiasis.
In other large series of cases of gout, nephrolithiasis has ranged from 28 percent (German spa) to 4 percent (San Francisco private practice) (Table VIII.63.1).Allopurinol therapy, which reduces the uric acid pool, decreases the incidence of uratic kidney stones and has the same effect in nongouty urate hyper- excretors who have a history of calcium stone formation.
History
For many centuries the term gout and podagra were as nonspecific as arthritis is in modern usage. The clinical differentiation of the disease was begun in the late seventeenth-century works of Thomas Sydenham, although his contemporary, Anton van Leeuwenhoek, using his simple microscope, described the appearance of crystals from a tophus. Nearly a century later, in 1776, Karl W. Scheele, a Swedish pharmacist, discovered an organic acid in urinary concretions which for that reason he called lithic acid. In 1797, at Cambridge, William H. Wollaston analyzed tophi and found that they contained “lithic acid.” In 1798, this substance was renamed acide ourique by the French chemist Antoine F. de Fourcroy because he also found it to be present in normal urine.
Another half century passed before uric acid was shown to be even more intimately related to gout. In 1847 and in 1854, London physician Alfred B. Garrod devised two tests whereby uric acid could be detected in blood in hyperuricemic states such as gout and uremia. He also demonstrated urate in subcutaneous tissues and articular cartilage in cases of gout. Garrod hypothesized that gout might result either from a loss of renal excretory capacity or from increased formation of uric acid. A century after the publication of his 1859 monograph on gout, both concepts were proved to be correct. In 1876 Garrod
Table VIΠ.63.1. Occurrence Ofnephrolithiasis with gout
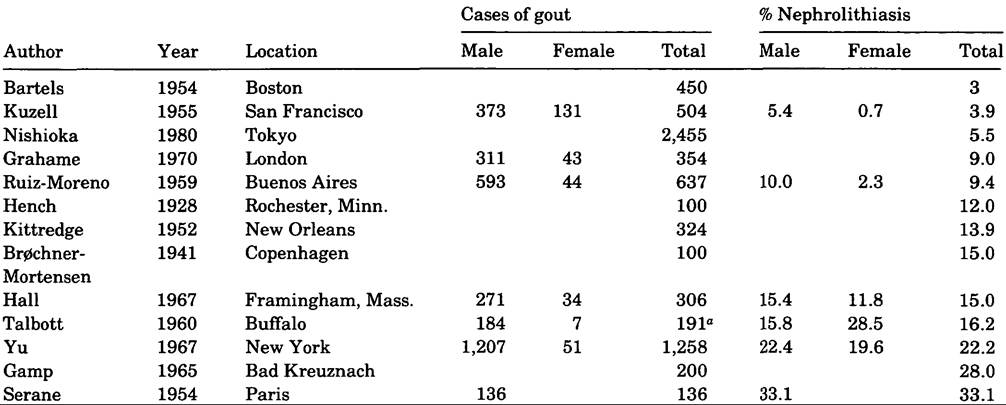
oAutopsied cases.
also postulated that acute gout results from the precipitation of sodium urate in a joint or adjacent tissue.
This was proven in 1962 by the elicitation of gouty inflammation following the injection of suspensions of sodium urate crystals into human and canine knee joints (Rodnan 1965).Beginning in 1871 numerous gravimetric assays ofurinary uric acid were devised, but none was sensitive enough to be applicable to the much smaller concentration in the blood. The wide variations of uric acid excretion and the lack of understanding of uric acid metabolism cast doubt on the causative relationship of uric acid to gout. Two paradoxical effects on clinical practice resulted. One was that the old belief in “retrocedent” or “anomalous” gout - the idea that a wide variety of symptoms or diseases are caused by a “gouty poison” - gained new adherents. The other was that clinicians virtually ceased making the diagnosis of gout. For example, at the Johns Hopkins Hospital (Baltimore), only 42 cases were admitted with this diagnosis during 1889-1903. At the Massachusetts General Hospital, only 9 cases of gout were found among 1,033 medical admissions for rheumatic diseases during 1893-1903 (Benedek 1987). Likewise, at a hospital in Cologne the diagnosis of gout was made only 14 times among 23,870 medical admissions (0.06 percent) during 18951900. However, in that hospital the diagnosis was made in 10 cases or 0.35 percent of the admissions during the first year that Oscar Minkowski, who was interested in this disease, was in charge of a medical service.
The Devonshire Royal Hospital in England represented the other extreme. During 1896-1900, gout was diagnosed in 2.42 percent of 14,224 admissions (324 male, 20 female); during the next 5-year period, with changes in the physician staff, the frequency of the diagnosis more than doubled to 5.26 percent of 15,836 admissions (743 male, 91 female) (Hill 1938). Clearly, such data do not prove the traditional impression that gout was peculiarly prevalent in England but, rather, suggest that the diagnosis was being made or missed very subjectively.
The first practical colorimetric technique sensitive enough to detect normal concentrations of uric acid in blood was devised by Otto Folin at Harvard University in 1912. Its sensitivity was gradually improved so that in 1938 the uric acid content of the blood was shown to be greater in men than in women, thereby correlating with the rarity of gout in women. However, physicians continued to be poorly aware of true gout. Philip Hench (1936) commented on this as follows:
If more than 50-70% of his patients have tophi he is too exclusive and is probably omitting cases of bona fide (even if pretophaceous) gout. Ifless than 35-40% have tophi or if more than 2-5% are females he is too inclusive, diagnosing gout where it does not exist.
Methodological specificity in uric acid determination was achieved in 1953 with a technique that employs the enzyme uricase. Nevertheless, most laboratories continue to use less specific methods that lend themselves to automation and give somewhat higher than “true” values (Benedek 1987).
Treatment
Therapy of gout has two components: (1) treatment of the acute attack and (2) prophylaxis, which seeks to decrease the uric acid pool of the body. The former has always been predominantly medicinal, whereas the latter has been both dietetic and medicinal. Colchicum in the form of various alcoholic or aqueous extracts from the bulb, stem, or seeds of the meadow saffron came into use in the second decade of the nineteenth century in France and England. It was included in the Dispensatory of the United States of America in 1836, although its use was advocated somewhat earlier. Hesitation about using colchicum was due to recognition of its toxicity, as manifested by severe diarrhea, which also was believed to be the mechanism of its therapeutic effect. The active component, colchicine, was isolated in 1820. Colchicine was available in pill form by 1900, but crude tinctures were still in use in the 1950s (Rodnan and Benedek 1970).
Until about 1910, when cinchophen was introduced, colchicine was the only remedy for acute gout. Cinchophen not only was effective in the acute gouty attack but, in contrast to colchicine, also was an analgesic. Because of its chemical resemblance to salicylate, cinchophen was presumed to be tolerated better than colchicine, which it virtually replaced in the treatment of acute gout. However, by the 1930s it became evident that cinchophen may cause severe and even fatal liver damage. Hence, its use faded out over a decade, and colchicine again became the standard treatment.
The fact that both cinchophen and salicylates increased the renal excretion of uric acid and thereby reduced the uric acid content of the blood was discovered in 1913 and 1915, respectively, but was not adapted to therapy. Two pharmaceutical breakthroughs occurred in 1951. Probenecid, a drug that had been developed to retard the excretion of penicillin, was found to accelerate the excretion of uric acid. Although it has no analgesic or antiinflammatory effect, it was well tolerated and convenient to take. As it reduced the serum uric acid concentration, the frequency of gouty attacks diminished and tophi shrank. The other discovery was phenylbutazone, which proved to have therapeutic effects similar to cinchophen. Like probenecid, it increased the excretion of uric acid, but also like colchicine, it counteracted the acute attack, and it was a nonspecific analgesic as well. However, it proved to be toxic, particularly to blood cell formation in elderly persons, and it has therefore fallen into disfavor.
Another pair of important pharmaceutical discoveries was introduced in 1963. Indomethacin effectively counteracts the acute gouty attack, and, although it does not alter the excretion of uric acid, it also does not depress blood formation; therefore, it gradually superseded phenylbutazone. Since then many other “nonsteroidal antiinflammatory drugs” have been found to be similarly effective. Allopurinol lowers the uric acid pool like probenecid, but by a different mechanism. It diminishes the synthesis of uric acid by inhibiting the activity of an enzyme (xanthine oxidase). Like probenecid, allopurinol is of no value in an acute gouty attack, but it has the advantages of effectiveness in the presence of renal failure, and the convenience of once per day dosage (Benedek 1987).
Dietetic attempts to treat or prevent gout are ancient. They were based on beliefs in the virtue of moderation in all things and, more specifically, in the belief that gout is caused in large measure by excesses in the consumption of food and alcoholic beverages. Aside from the demonstration in 1924 that starvation results in an increased blood uric acid concentration, scientific investigations of gout have been done only since the 1960s. The most important finding has been that circumstances that result in the formation of certain organic acids, particularly lactate and beta-hydroxybutyrate, block the excretion of uric acid and thereby increase the possibility that a gouty attack may occur. Starvation, substantial alcohol ingestion, especially without eating, and uncontrolled diabetes mellitus are such conditions.
Uric acid found in the body is not absorbed as such, but is synthesized from breakdown products of various foodstuffs, particularly those that are rich in nucleoproteins (Seegmiller, Laster, and Howell 1963). A low-fat, largely vegetarian (60 g/day protein) diet reduces the serum uric acid concentration by 1 to 2 milligrams below that found in a more typical American diet (Gutman and Yu 1955). The effect such diets have on reducing gouty attacks is equivocal. Since the advent of urate-depleting drugs such as probenecid and allopurinol, however, dietetic therapy has become irrelevant except for the general advantages of weight reduction for the obese gout patient.
Gout rarely is a direct cause of death, although premature death due to diseases with which gout is associated (principally hypertensive or arteriosclerotic cardiovascular disease) is fairly common. For reasons that are unclear, untreated hypertension with grossly normal renal function is frequently associated with hyperuricemia. Because treatment of hypertension usually includes drugs that interfere with the excretion of uric acid, hyperuricemia is greater and more prevalent in treated than in untreated hypertensive patients. Thus, according to a sιπwey in London, 31 percent of untreated hypertensive men and 23 percent of untreated hypertensive women had hyperuricemia, 12 percent having had attacks of gout, whereas 59 percent and 57 percent, respectively, of hypertensive men and women under treatment were hyperuricemic (Breckenridge 1966). Conversely, in a series of 354 gout patients in London, 52 percent had a diastolic blood pressure in excess of 90 millimeters (Grahame and Scott 1970), and of the cases studied by Yu (1984) in New York, 30 percent were considered hypertensive. Hyperlipidemia appears not to be correlated directly with hyperuricemia. Rather, both are associated with hypertension and obesity. According to the Framingham study, angina pectoris is twice as frequent among gouty as among nongouty men (Abbott et al. 1988), and Yu found that the causes of death among 427 gout patients were cardiovascular in 66 percent of the cases (Yu 1984).
Epidemiology
When considering the epidemiology of primary gout, one must focus separately on hyperuricemia and the factors that influence it. Although a rough correlation does exist between the level of hyperuricemia and the likelihood of an attack of gouty arthritis, the predictive value is poor and appears to be worse in certain groups than in others. Of the measurable factors that affect the serum uric acid concentration, the most important are the protein content of the diet and overweight. Weight and the rate of uric acid metabolism are to some extent genetically predetermined. However, the immediate cause of a gouty attack remains unknown.
Worldwide the severity and prevalence of gout have changed paradoxically since the 1940s. In the highly developed countries, as a result of the advent of effective prophylactic drug therapy, the disease is now rarely disabling. Elsewhere, however, it has become more prevalent, predominantly as a result of “improved” diets. Unfortunately, there were no epidemiological surveys of serum uric acid or gout in primitive societies before the 1960s, so that hypotheses about whether ethnic differences are genetic or the result of recent environmental changes are weakened by a lack of baseline data. The different biochemical techniques that have been used introduce another obstacle to any comparison of data from various surveys.
The prevalence of gout that is reported depends on the diagnostic criteria used; on the population from which the cohort is drawn; and on whether the diagnosis is based on questionnaires or on single or repetitive examinations. For example, a predominantly younger population can be expected to have a lower prevalence of gout than one with a higher mean age; a workforce may have a lower prevalence than a random sample that may include persons who are disabled by gout and associated diseases. Secondary gout, in which the disease results from (1) accelerated purine metabolism inherent in another disease, usually of the blood, (2) diminished excretion of uric acid resulting from renal failure, or (3) effects of toxins such as lead, is not an epidemiological con- founder because these circumstances are readily identified and uncommon. At present, secondary gout arises most frequently as an incidental effect of certain antihypertensive medications.
United States and Europe
Only a few of the larger American and European surveys of serum uric acid values will be cited. In a survey in Tecumseh, Michigan, 9.2 percent of men over 20 years of age had uric acid values greater than 7.0 mg%, and 8.7 percent of the women had values greater than 6.0 mg% (Mikkelsen, Dodge, and Valkenburg 1965). In Framingham, Massachusetts, 4.8 percent of men and 3.3 percent of women met this criterion (Hall et al. 1967). Racial comparisons in rural Georgia (31 percent black men, 35 percent black women) revealed no racial differences in mean uric acid values. However, the prevalence of hyperuricemia was high, ranging from 13.6 percent for white men to 21.1 percent for black women. This was attributed largely to the association between hypertension and hyperuricemia and the use of antihypertensive medications (Klein et al. 1973). A comparison of uric acid values between white U.S. and Brazilian male military recruits showed Americans to have higher uric acid concentrations: mean 4.87 mg% versus 4.05 mg%, with 3.26 percent versus 0.35 percent having a value above 7.0 mg%. The difference correlated best with the 17 percent greater mean weight of the Americans (Florey and Acheson 1968).
Several American surveys have compared the serum uric acid levels of executives and either lower- level employees or age-matched general population samples. The executives have consistently been found to have higher mean urate concentrations and a larger proportion of cases of hyperuricemia (Mon- toye et al. 1967). This finding, which has been inconsistently confirmed in Europe, has not been explained by differences in physiognomy, blood pressure, or medications.
In a survey of nearly 24,000 men in Paris, 17.5 percent were found to have a uric acid value of 7.0 mg%, and 9.9 percent with a value of 7.5 mg% (Zalokar et al. 1972). Two English studies gave results more consistent with U.S. findings, with 7.2 percent and 10.8 percent of men having concentrations of 7.0 mg%. In Finland, 5.2 percent of men and 3.5 percent of women had uric acid values of 7.0 mg% and 6.0 mg%, respectively (see Table VIII.63.2). The relation of uric acid values to nutrition was demonstrated epidemiologically by an investigation conducted in East Germany from 1969 until 1980 with samples of 726 to 1,199 adults. Duringthese 12 years the mean serum urate content increased by about 50 percent (4.2 mg% to 6.3 mg% in men; 3.4 mg% to 5.2 mg% in women), and the percentage with hyperuricemia increased from 2.4 to 29.0 in men and from 1.8 to 19.7 in women. These changes correlated well with increases in the meat consumption of 37 percent and alcohol consumption of 68 percent (Thiele and Schroeder 1982).
A study based on the records of general practitioners in Great Britain showed the prevalence of gout over the age of 15 years to be 7.3 per 1,000 males in England, but only 2.8 per 1,000 in Scotland. Among females the prevalence was 1.3 and 0.7 per 1,000 in England and Scotland, respectively (Currie 1979). A survey among men between the ages of 45 and 74 in three English towns demonstrates that not only sex and age distribution but also how data are obtained influence the results. A simple questionnaire was mailed to over 15,000 men, of whom two-thirds completed it. In the three communities, 3.9 percent, 4.5 percent, and 4.8 percent (average 4.4 percent) claimed to have gout, which was more than three times the prevalence for age-matched English men obtained from physicians’ records (Gardner et al. 1982).
In the Framingham investigation, gout was diagnosed in 2.8 percent of the men and 0.4 percent of the women (Hall et al. 1967). The biennial incidence has been 3.2 per 1,000 men and 0.5 per 1,000 women (Mikkelsen, Dodge, and Valkenburg 1965). A survey Table VIΠ.63.3. Prevalence of gout in relation to serum uric acid content in men
Table VIII.63.2. Prevalence Ofhyperuricemia
| Location | Year | Males | Females | ||||||
| Cases | Percent >7 mg% | Cases | Percent >6 mg% | ||||||
| England | 1962 | 436 | 2.3 | 475 | 2.3 | ||||
| Japan (Osaka) | 1966 | 378 | 4.0 | 434 | 2.5 | ||||
| U.S. (Mass.) | 1967 | 2,283 | 4.8 | 2,844 | 3.3 | ||||
| Bulgaria | 1966 | 188 | 4.8 | 232 | 7.0 | ||||
| Finland | 1969 | 737 | 5.2 | 1,048 | 3.5 | ||||
| England | 1977 | 512 | 7.2 | 254 | 0.4 | ||||
| Scotland (Glasgow) | colspan=2 bgcolor=white>1977337 | 8.0 | |||||||
| U.S. (Mich.) | 1965 | 2,987 | 9.2 | 3,013 | 8.7 | ||||
| England (Liverpool) | 1966 | 331 | 10.8 | ||||||
| U.S. (New York) | 1971 | 984 | 12.3 | ||||||
| France (Paris) | 1972 | 23,923 | 17.5 | ||||||
| New Zealand (white) | 1966 | 202 | 23.3 | 228 | 16.7 | ||||
| Palau Islands | 1972 | 219 | 36 | 291 | 24 | ||||
| Samoa (urban) | 1981 | 319 | 36 | 415 | 23 | ||||
| Samoa (rural) | 1981 | 356 | 43 | 384 | 29 | ||||
| Rarotonga | 1966 | 243 | 44 | 227 | 43 | ||||
| Mariana Islands | 1966 | 160 | 45 | 175 | 28 | ||||
| Mariana Islands | 1972 | 395 | 49 | 504 | 30 | ||||
| Tokelau Islands | 1966 | 191 | 48 | 188 | 49 | ||||
| New Zealand (Maori) | 1966 | 388 | 49 | 378 | 42 | ||||
| Nauru | 1978 | 217 | 64 | 238 | 60 | ||||
| Uric acid (mg%) | Framingham, Mass.α | Paris, France6 | |||||||
| Subjects | % Gout | Subjects | % Gout | ||||||
| 8.0 | 22 | 36.3 | 306 | 17.6 | |||||
| Total | 2,069 | 3.0 | 4,257 | 3.3 | |||||
“Hall et al. (1967). 6Zalokar et al. (1972).
of more than 4,000 employed men in Paris found that 3.5 percent reported a history of gout and 3.0 percent had been treated for this disease (Zalokar et al. 1972) (Table VIII.63.3). However, most investigations of adult male Caucasian populations have identified gout in less than 1 percent. A large survey of industrial workers in New York, for example, revealed no cases among women or among men under the age of 40, and a prevalence of only 0.12 percent above that age (Brown and Lingg 1961). No instances of gout were detected among nearly 3,400 persons above age 15 in Holland in 1954, or among 4,300 persons in Sofia, Bulgaria. In a small Finnish town, one case was found among 787 men and none in 1,048 women.
Non-Caucasian Populations
Reports of gout in non-Caucasian populations are relatively recent. The first case report pertained to a 31-year-old African servant who died of an infection in Edinburgh in 1807, where he had often been subject to severe pains that occurred about midnight in one or the other of his great toes. A medical missionary in Hawaii in the early 1830s reported that rheumatism frequently occurred there, and, although gout might also be expected to be common because of indulgent eating habits, the mild quality of the food suggested otherwise and was unlikely to promote the disease. Similarly, a military surgeon in New Zealand in the 1850s found that although “rheumatic affections” were much more frequent among New Zealanders than among the English, gout was unknown. Hench, a leading expert, wrote in the 1948 edition of Cecil’s Textbook of Medicine that gout “is common in England and France, less common but increasing in North America. Hebrews are affected, prosperous American Negroes occasionally.” Eugene Traut, in his textbook on rheumatic diseases, stated similarly in 1952 that gout “is unknown in China, Japan, and the tropics.... It is rare in Negroes.”
The extent to which such statements reflected either ignorance or changing circumstances cannot be ascertained. They clearly are incorrect now. The most ubiquitous factor to account for an increased prevalence of gout is the increased proportion of proteins in many diets, which increases the amount of uric acid that is synthesized. Comparisons of mean serum uric acid values of most adequately nourished populations worldwide give similar values. The exceptions remind us that there are unidentified, presumably genetic factors that result in differences among groups that would be assumed not to differ empirically. A comparative study between Blackfeet Indians in Arizona and Pima Indians in Montana provides an example (Table VIII.63.4). The mean urate concentration and the prevalence of hyperuricemia of the Blackfeet of both sexes were significantly higher than among the Pima. Furthermore, although a high degree of correlation between obesity and hyperuricemia generally is found, more of the Pima, especially the women, were obese.
It was noted coincidentally in Honolulu and Seattle in 1957-8 that an unusually high proportion of Filipino men who visited outpatient clinics had gout or hyperuricemia. In Honolulu, remarkably, in a study of 100 men over 40 years of age, fully half were found to be hyperuricemic, and 32 had clinical gout. Among admissions to the county hospital in Seattle during 64 months, new cases of gout were diagnosed in 2.5 percent OfFilipinos and in 0.13 percent of all other patients. The high prevalence of gout among Filipinos living in Hawaii was confirmed by other data, such as the fact that, in a 16-month period, 20 of 24 health insurance claims for treatment of gout were submitted by Filipinos. The mean serum uric acid of Filipino men in Seattle, as in Honolulu, was significantly higher than that of other ethnic groups. This contrasted with a diagnosis of gout in 0.004 percent of admissions to the general hospital OfManila and a normal mean serum uric acid among Filipino men sampled at four sites in the Philippine Islands. This difference could not be attributed entirely to the larger mean body mass of the Filipinos who lived in Hawaii or Washington State (Healey et al. 1967).
Table VIΠ.63.4. Serum uric acid in IwoAmericanIndian tribes
| Tribe | Subjects | Total | Mean urate (mg%) | Percent >7 mg% | Percent >6 mg% | Percent gout |
| Blackfeet | M | 587 | 5.21 ± 1.12 | 5.4 | 0 | |
| F | 435 | 4.47 ± 1.16 | 9.2 | 0 | ||
| Pima | M | 473 | 4.56 ± 1.20 | 2.5 | 0.4 | |
| F | 475. | 3.85 ± 1.05 | 1.0 | 0 |
Source: O’Brien et al. (1966)
Although the ability of gouty individuals to excrete uric acid generally is normal, when this function is challenged by administering a purine (urate precursor) load, individual differences in the maximum excretory capacity can be identified. In such a study, 4 of 13 nongouty Filipino men were unable to increase their excretion of uric acid. The other 9 Filipino and all 10 Caucasian men exhibited the normal response of approximately doubling the quantity excreted (Healey and Bayani-Sioson 1971). This observation led to the hypothesis that some ethnic groups, such as Filipinos, include an unusually large proportion of persons who have a relatively low genetically determined limit to their renal excretory capacity for urate. As long as such individuals consume a low- protein diet, such as many of the Asian rice-based diets, or diets based on yams, their excretory mechanism is not saturated, serum urate remains in the normal range of Caucasians, and gout rarely occurs. When the protein consumption of persons with this latent defect increases — that is, as their diet becomes “Westernized” - the excretory capacity is overwhelmed, urate accumulates, and gout becomes more frequent.
There is a marked difference in the prevalence of hyperuricemia between Caucasian and various Pacific island populations. When 7.0 mg% and 6.0 mg% are used as the upper limits of normal for men and women, respectively, less than 10 percent of most unselected Caucasian populations, but more than 40 percent of many Pacific populations, exceed these values (Table VIΠ.63.2). Many surveys have been conducted since the 1960s: among Maoris in New Zealand, Polynesians on Rarotonga (south of Samoa) and in the Cook Islands, Micronesians in the Marianas and Nauru, Melanesians in Samoa, among others. The hyperuricemia cannot be attributed entirely to dietary changes, as discussed in regard to Filipinos, nor is alcohol consumption necessarily a contributory factor. The highest prevalence of hyperuricemia has been found on the Micronesian island of Nauru (64 percent of men, 60 percent of women). The diet here, as among the Rarotongans and Samoans, had largely become Westernized by the time these surveys were conducted. However, disparate groups such as aborigines in northern Australia and natives of New Guinea and of the Tokelau Islands (north of Samoa) were hyperuricemic on their traditional diets. The complexity of the uricemia-gout relationship is illustrated by the unexplained observation that, although the New Zealand Maoris, Tokelauans, and Rarotongans have the same high prevalence of hyperuricemia, a fourfold difference exists in the prevalence of gout: 10.4 percent, 5.3 percent, and 2.5 percent, respectively (Prior 1981).
Nevertheless, a prospective study of gout in Maoris has shown a high correlation between the occurrence of acute gout and the level of uricemia (Brauer and Prior 1978). In 11 years, gout developed in 31 percent of men and 36 percent of women with a serum uric acid greater than 8 mg%, versus 2.8 percent and 0.6 percent, respectively, of subjects having uric acid concentrations below 6 mg% (Yu 1984). These data closely resemble the findings in Framingham, Massachusetts. In the larger sample of that community, clinical gout had developed in 36 percent of men with serum uric acid levels greater than 8 mg% and in 25 percent of women with a value greater than 7 mg% (Hall et al. 1967). The difference between these two cohorts lies in the 2 mg% greater mean serum uric acid content of the Maoris, and probably not in any other predisposing factor for the occurrence of gout.
Surveys in the early 1960s in the Osaka district of Japan showed a very low prevalence of hyperuricemia. Gout was diagnosed in 0.3 percent of men and in no women. With the continued Westernization of the diet, however, an anticipated increase in the prevalence of gout is occurring. Studies in Tokyo in the 1970s have shown mean uric acid levels to be the same as in Caucasian populations (males: 5.64 ± 1.45 mg%; females: 4.40 ± 1.09 mg%). The prevalence of gout in men has increased to 1.2 percent, but the proportion of gouty women was still much lower (0.9 percent of all cases) than in Caucasians. The clinical characteristics of gout are the same and occur in similar frequencies as in Caucasian populations (Nishioka and Mikanagi 1980).
A Chinese author claimed that the first case of gout to be described in China occurred in 1948, and that by 1959 he could collect only 12 cases, 10 with tophi. This almost certainly reflects socioeconomic rather than biological circumstances. The general prevalence of gout may indeed have been low because of the widespread, inadequately low protein diet, but this would have pertained particularly to the large segment of the population that lacked medical care. In regard to the well-nourished upper classes, a lack of diagnostic acumen may have been at least partially responsible.
In the Taiwanese literature, only 19 cases of gout were reported between 1903 and 1964, according to one author. However, in 1963 another author reported 61 cases-5 percent of the clientele of a rheumatology clinic. Of these, 35 were immigrants from the Chinese mainland.
A study of serum uric acid of 100 Chinese men who lived in British Columbia showed a higher mean value (5.44 ± 1.08 mg%) than that of 200 Caucasian men (4.55 ± 1.02 mg%) (Ford and de Mos 1964). The difficulty of interpreting such data is shown by a comparison of serum uric acid of Chinese living on Taiwan and in Malaya, using the same analytic technique. The mean concentration on Taiwan was 4.99 ± 0.91 mg% for men and 3.87 ± 0.78 mg% for women, whereas in Malaya these values were, respectively, 6.11 ± 1.29 mg% and 4.52 ± 0.9 8 mg% - significantly higher (Duff et al. 1968). At a hospital in New York, 13 cases of gout were seen among Chinese patients in 11 years, an incidence similar to that of other races. Only 1.9 percent of the 2,145 primary gout patients of the Mount Sinai Hospital of New York were Chinese. Yu (1984) interpreted this as evidence of the infrequency of gout among this racial group.
Aside from South Africa, there is little relevant information from the African continent, and most is derived from hospital admissions. Seven cases of gout (five “upper class”) were seen at the principal Ugandan hospital in 6 years (1962-7). During 30 months (1960-2) 3 cases were diagnosed at a hospital in Nairobi, Kenya, which represented 11 per 100,000 admissions, whereas during the 5 years 1977-81,19 cases were seen at the University Hospital in Durban, South Africa, which represented 4.7 per 100,000. Fifteen of these patients were male, and most were poor city dwellers (Mody and Naidoo 1984). A survey in a Nigerian village showed uric acid levels above 6 mg% in 34 percent of men and 13 percent of women. A more extensive investigation in rural south Africa revealed a normal Caucasian distribution of uric acid values, but no cases of gout among more than 1,000 adults.
Table VΠL63.5. Serum uric acid in South African black and white populations
| Population | Age range | Subjects | Mean uric acid (mg%) |
| African males | |||
| Tribal | 18-75+ | 80 | 4.7 ± 1.03 |
| Rural | 14-84 | 128 | 5.0 ± 1.11 |
| Urban | 15-90 | 144 | 6.1 ± 1.45 |
| White urban | 16-95 | 213 | 6.2 ± 1.27 |
| African females | |||
| Tribal | 15-75+ | 399 | 3.9 ± 0.85 |
| Rural | 14-96 | 242 | 4.6 ± 1.44 |
| Urban | 15-90 | 280 | 5.2 ± 1.34 |
| White urban | 16-88 | 298 | 5.0 ± 1.20 |
Source: Beighton et al. (1977).
The effect on uricemia of the urbanization of primitive people has been well illustrated by studies in South Africa that showed the lowest mean serum values in a tribal population, higher values in a village, and the highest levels, equal to those of urban whites, in urban (Soweto) blacks (Table VIII.63.5). The combined three black populations (621 men, 1,364 women) contained no cases of gout, whereas 3 of 240 white men and 1 of 332 white women had this disease (Beighton et al. 1977). A survey in Ethiopia in 1961-3 similarly showed the lowest values among rural Ethiopians, intermediate values among urban Ethiopians, and the normal, highest value among Caucasian and Indian urban professionals.
Data from Israel are analogous. Desert Bedouins were found to have lower serum uric acid values than villagers of the same Arabic stock, and the latter results were the same as were obtained from a nearby Jewish population in Haifa. These variations are presumed to be related to changes in nutrition associated with changes in life-style (Dreyfuss, Yaron, and Balogh 1964).
Thomas G. Benedek
Bibliography
Abbott, R. D., et al. 1988. Gout and coronary heart disease: The Framingham study. Journal of Clinical Epidemiology 41: 237-42.
Beighton, P., et al. 1977. Rheumatic disorders in the South African Negro. Part ΓV. Gout and hyperuricemia. South African Medical Journal 51: 969—72.
Benedek, T. G. 1987. A century of American rheumatology. Annals of Internal Medicine 106: 304—12.
Brauer, G. W., and I. A. Prior. 1978. A prospective study of gout in New Zealand Maoris. Annals of the Rheumatic Diseases 37: 466—72.
Breckenridge, A. 1966. Hypertension and hyperuricemia. Lancet 1: 15—18.
Brown, R., and C. Lingg. 1961. Musculoskeletal complaints in an industry. Arthritis and Rheumatism 4: 283-302.
Currie, W. J. 1979. Prevalence and incidence of the diagnosis of gout in Great Britain. Annals of the Rheumatic Diseases 38: 101—6.
Dreyfuss, F., E. Yaron, and M. Balogh. 1964. Blood uric acid levels in various ethnic groups in Israel. American Journal of the Medical Sciences 247: 438—44.
Duff, I. F., et al. 1968. Comparison of uric acid levels in some Oriental and Caucasian groups unselected as to gout or hyperuricemia. Arthritis and Rheumatism 11: 184-90.
Florey, C. D., and R. M. Acheson. 1968. Serum uric acid in United States and Brazilian military recruits, with a note on ABO blood groups. American Journal of Epidemiology 88: 178—88.
Ford, D. K., and A. M. de Mos. 1964. Serum uric acid levels of healthy Caucasian, Chinese and Haida Indian males in British Columbia. Canadian Medical Association Journal 90: 1295—7.
Gardner, M. J., et al. 1982. The prevalence of gout in three English towns. International Journal OfEpidemiology 11: 71-5.
Grahame, R., and J. T. Scott. 1970. Clinical survey of 354 patients with gout. Annals of the Rheumatic Diseases 29: 461-8.
Gutman, A. B., and T.-F. Yu. 1955. Prevention and treatment of chronic gouty arthritis. Journal of the American MedicalAssociation 157: 1096—102.
Hall, A. P., et al. 1967. Epidemiology of gout and hyperuricemia. A long-term population study. American Journal OfMedicine 42: 27—37.
Healey, L. A., and P. S. Bayani-Sioson. 1971. A defect in the renal excretion of uric acid in Filipinos. Arthritis and Rheumatism 14: 721—6.
Healey, L. A., et al. 1967. Hyperuricemia in Filipinos: Interaction of heredity and environment. American Journal of Human Genetics 19: 81-5.
Hench, P. S., et al. 1936. The problem of rheumatism and arthritis (third rheumatism review). Annals of Internal Medicine 10: 754—909.
Hill, L. C. 1938. Gout. Lancet 1: 826—31.
Klein, R., et al. 1973. Serum uric acid: Its relationship to coronary heart disease risk factors and cardiovascular disease, Evans County, Georgia. Archives OfInternal Medicine 132: 401—10.
Mikkelsen, W. M., H. J. Dodge, and H. Valkenburg. 1965. The distribution of serum uric acid values in a population unselected as to gout or hyperuricemia. American Journal of Medicine 39: 242—51.
Mody, G. M., and P. D. Naidoo. 1984. Gout in South African blacks. Annals of Rheumatic Diseases 43: 394—7.
Montoye, H. J., et al. 1967. Serum uric acid concentration among business executives. Annals of Internal Medicine 66: 838—49.
Nishioka, K., and K. Mikanagi. 1980. Hereditary and environmental factors influencing on the serum uric acid throughout ten years’ population study in Japan. Advances in Experimental Medicine and Biology 122A: 155-9.
O’Brien, J. B., T. A. Burch, and J. J. Bunim. 1966. Genetics of Iiyperuricaemia in Blackfeet and Pima Indians. Annals of the Rheumatic Diseases 25: 117.
Prior, 1.1981. Epidemiology of rheumatic disorders in the Pacific with particular emphasis on hyperuricemia and gout. Seminars in Arthritis and Rheumatism 13: 145-65.
Rodnan, G. P. 1965. Early theories concerning etiology and pathogenesis of gout. Arthritis and Rheumatism 8: 599-609.
Rodnan1 G. P., and T. Benedek. 1970. The early history of antirheumatic drugs. Arthritis and Rheumatism 13: 145-65.
Seegmiller, J. E., L. Laster, and R. R. Howell. 1963. Biochemistry of uric acid and its relation to gout. New England Journal of Medicine 268: 712—6, 764—73, 821-7.
Thiele, P., and H.-E. Schroeder. 1982. Epidemiologie der Hyperurikamie und Gicht. Zeitschrift fiir die Gesamte Innere Medizin und ihre Grenzgebiete 37: 406-10.
Yu, T.-F. 1984. Diversity of clinical features in gouty arthritis. Seminars in Arthritis and Rheumatism 13: 360-8.
Yu, T.-F., and A. B. Gutman. 1967. Uric acid nephrolithiasis in gout: Predisposing factors. Annals OfInternal Medicine 67: 1133-48.
Zalokar1 J., et al. 1972. Serum uric acid in 23,923 men and gout in a subsample of 4257 men in France. Journal of Chronic Disease 25: 305-12.